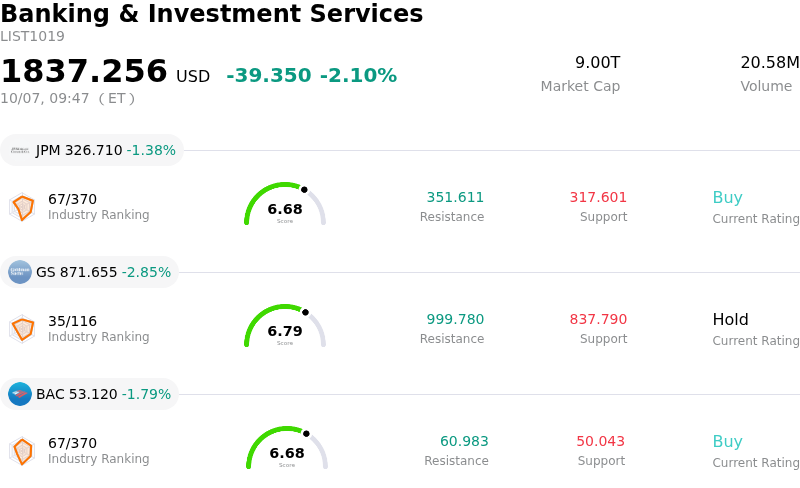
Banco Santander SA (SAN) opened down by 3.53%. The Banking & Investment Services sector is down by 2.10%. The company underperformed the industry. Top 3 stocks by turnover in the sector: JPMorgan Chase & Co (JPM) down 1.44%; Goldman Sachs Group Inc (GS) down 2.85%; $Bank of America Corp(BAC-N)$ (BAC) down 1.79%.
What is driving Banco Santander SA (SAN)’s stock price down today?
European banking equities faced downside pressure as macroeconomic uncertainty and sector-wide profit-taking weighed on major lenders. Rising geopolitical tension, volatile commodity prices, and fluctuating European bond yields triggered broader risk-off sentiment across Continental financial benchmarks, including Spain's IBEX 35 and the Euro Stoxx Banks index. For Banco Santander, which had recently traded near multi-year highs following strong capital return announcements, today's retreat reflects systematic sector profit-taking ahead of the upcoming third-quarter corporate earnings season.
From a fundamental standpoint, investor sentiment remains sensitive to regional performance disparities across Santander's geographical footprint. While the bank's European operations have benefited from elevated interest rates, lingering net interest income margin compression and elevated loan-loss provisions in key Latin American units—particularly Santander Brasil—continue to create a drag on consolidated earnings expectations. In addition, institutional repositioning has picked up following corporate restructuring across international corporate and investment banking divisions, where executive leadership changes and heightened cost-containment measures are being implemented.
Despite short-term volatility, Santander continues to execute its aggressive capital management strategy, supported by an ongoing multi-billion-euro share buyback program and a scheduled interim cash dividend. Cumulative repurchases under the active buyback tranche have systematically reduced the bank's outstanding share count, offering structural capital support. However, with the stock digesting substantial multi-month gains and lacking immediate earnings catalysts, technical profit-taking and broader institutional portfolio rebalancing dominate price action. Analysts expect volatility to remain elevated until third-quarter financial results provide updated guidance on credit quality and net interest margins.
Technical Analysis of Banco Santander SA (SAN)
Technically, Banco Santander SA (SAN) shows a MACD (12,26,9) value of -0.162, indicating a sell signal. The RSI at 39.913 suggests neutral condition and the Williams %R at 74.143 suggests sell condition. Please monitor closely.
Fundamental Analysis of Banco Santander SA (SAN)
Banco Santander SA (SAN) is in the Banking & Investment Services industry. Its latest annual revenue is $65.95B, ranking 5 in the industry. The net profit is $15.90B, ranking 5 in the industry. Company Profile
Over the past month, multiple analysts have rated the company as Buy, with an average price target of $14.71, a high of $15.60, and a low of $13.82.
More details about Banco Santander SA (SAN)
Company Specific Risks:
- Analyst Price Target Cuts: Recent price target reductions from major brokerages, including RBC, have triggered profit-taking and institutional rebalancing, with analysts citing elevated valuation multiples and peaking net interest margin benefits ahead of third-quarter earnings.
- Macroeconomic Volatility and Bank Sector Rotation: Surging global bond yields and sovereign rate fluctuations have driven a broad rotation out of international financial equities, increasing intraday selling pressure on Santander as investors reassess credit environment risks.
- Capital Remuneration Policy Shift: Official Form 6-K filings outline a planned shift in the bank's long-term ordinary remuneration policy starting after 2026, reducing the cash dividend allocation to 35% of underlying profit, which subjects future shareholder returns to share buyback execution and regulatory approvals.
- Technical Volume Divergence and Resistance Overhead: Recent intraday price action has experienced a noticeable drop in trading volume alongside upward price movement, creating a negative volume-price divergence near key technical resistance around $14.17 to $14.19 that elevates near-term downside risk.
Find out more