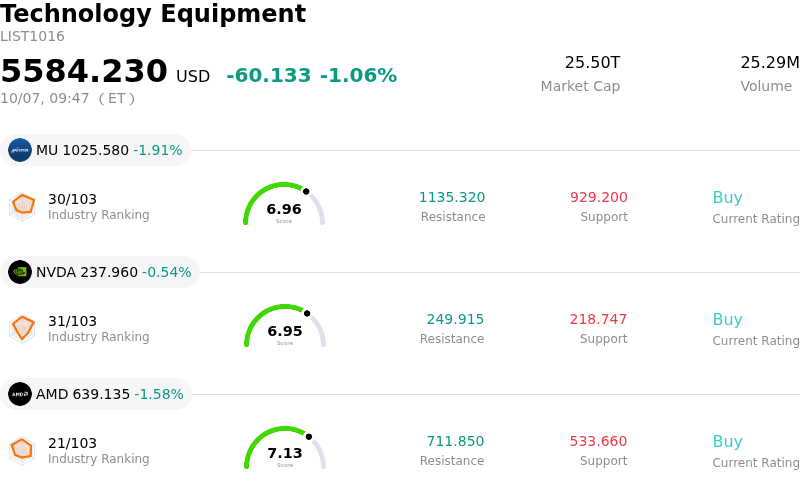
Texas Instruments Inc (TXN) opened down by 3.14%. The Technology Equipment sector is down by 1.06%. The company underperformed the industry. Top 3 stocks by turnover in the sector: Micron Technology Inc (MU) down 1.76%; NVIDIA Corp (NVDA) down 0.51%; Advanced Micro Devices Inc (AMD) down 1.23%.
What is driving Texas Instruments Inc (TXN)’s stock price down today?
Texas Instruments experienced downward pressure and heightened intraday volatility as profit-taking intensified following a substantial multi-month rally. With the equity trading at an elevated price-to-earnings multiple relative to historical averages and intrinsic value estimates, investors have grown increasingly sensitive to valuation risks. The broader semiconductor sector faced rotational selling pressure, prompting institutional market participants to trim exposure and secure gains ahead of the company's upcoming quarterly financial report.
Fundamental factors surrounding capital deployment also weighed on market sentiment. The company remains engaged in an ambitious multiyear manufacturing buildout, expanding its domestic 300mm analog wafer fabrication capacity to enhance long-term operational efficiency and supply chain resilience. Although this strategy supports future margin expansion across key end markets such as automotive, industrial, and artificial intelligence infrastructure, the high capital expenditure burden continues to temporarily weigh on free cash flow metrics and near-term profitability.
Macroeconomic uncertainty and end-market inventory dynamics further compounded the day's pullbacks. Because analog and embedded chips serve as baseline components across widespread industrial and commercial supply chains, broader economic fluctuations directly influence order visibility. As investors balance Texas Instruments' long-term structural competitive advantages against short-term cyclical friction and elevated multiples, trading turned volatile, driving the stock lower during the session.
Technical Analysis of Texas Instruments Inc (TXN)
Technically, Texas Instruments Inc (TXN) shows a MACD (12,26,9) value of 5.327, indicating a buy signal. The RSI at 61.455 suggests neutral condition and the Williams %R at 25.732 suggests buy condition. Please monitor closely.
Fundamental Analysis of Texas Instruments Inc (TXN)
Texas Instruments Inc (TXN) is in the Technology Equipment industry. Its latest annual revenue is $17.68B, ranking 14 in the industry. The net profit is $4.97B, ranking 10 in the industry. Company Profile
Over the past month, multiple analysts have rated the company as Buy, with an average price target of $309.53, a high of $400.00, and a low of $184.59.
More details about Texas Instruments Inc (TXN)
Company Specific Risks:
- Stretched Valuation Premium: Trading at a trailing P/E ratio over 42x and significantly above fair value estimates, the stock faces downside re-rating risk if upcoming Q3 earnings results or forward guidance fail to justify its elevated earnings multiple.
- CapEx Outlays Weighing on Cash Flow: Intensive multiyear capital expenditures required for expanding U.S. 300mm analog wafer fabrication capacity continue to pressure near-term free cash flow and compress operating margins during the buildout cycle.
- Persistent Insider Divestment: Corporate insiders have sold approximately $119 million in shares over the past 12 months with zero insider share purchases, signaling persistent caution among company executives regarding near-term stock performance.
- Industrial and Auto Sector Demand Headwinds: Macroeconomic pressure and softening demand across traditional non-AI semiconductor end-markets, including industrial automation and automotive applications, risk offsetting momentum gained from AI-driven data center growth.
Find out more